| Widget Connector | ||||||||||
|---|---|---|---|---|---|---|---|---|---|---|
|
| Info |
|---|
See this use-case live on our sandbox environment here: https://radbee-sandbox.atlassian.net/wiki/spaces/~209251919/pages/81362969/Status+Reports |
It’s Friday afternoon, and you’re excited to start your weekend! There’s only one thing left to do – your weekly status report. You already track all your work in Jira and Confluence, so creating a separate report sure feels like unnecessary work. Why can’t your boss just look in the Atlassian tools to see what you’ve done?
The answer is that Jira data is a continuously moving target. As soon as data is created or updated, changes also propagate across dashboards, boards, and built-in reports. This is great when you need real-time data, but what about when you need a static report for historical tracking purposes?
With Jira Snapshots for Confluence, you can simply take a snapshot of Jira data and display it in Confluence. No need to export information, manually create a time-consuming report, and email it to your manager. With the Jira Snapshots macro for Confluence, you can display a time-stamped, static snapshot of Jira issue data.

| Info |
|---|
Use case by Rachel Wright The author of Jira Strategy Admin Workbook |
How to Do It:
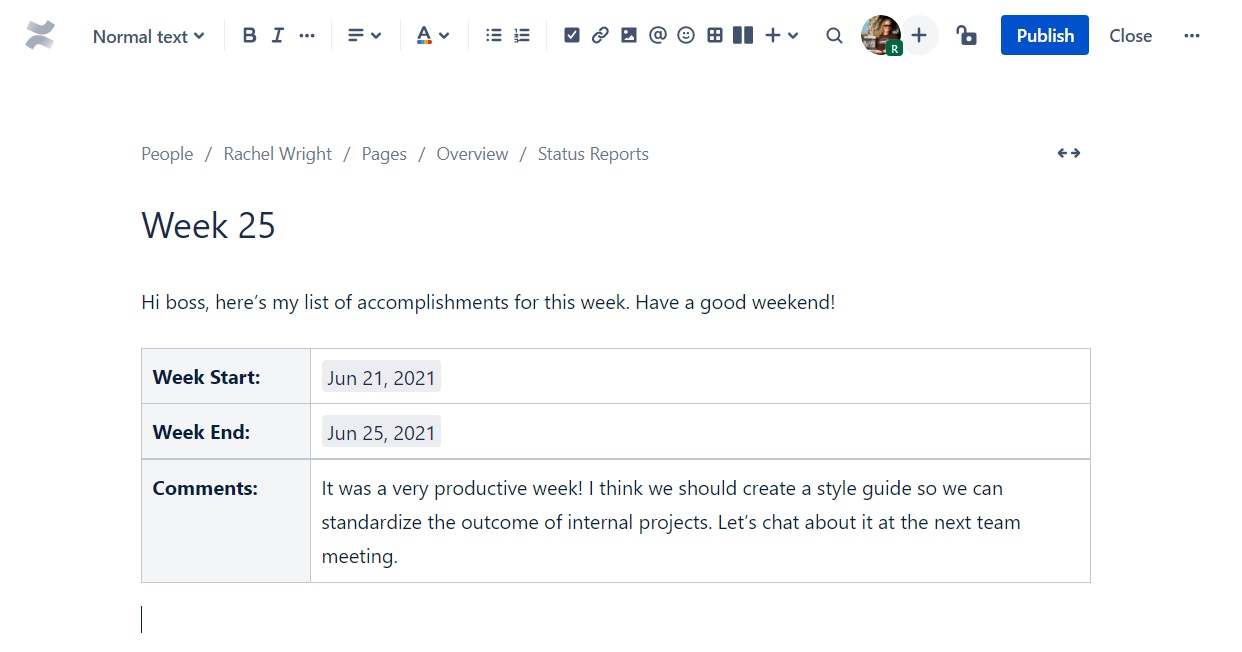
Log in to Confluence, and create a new page for the status report.
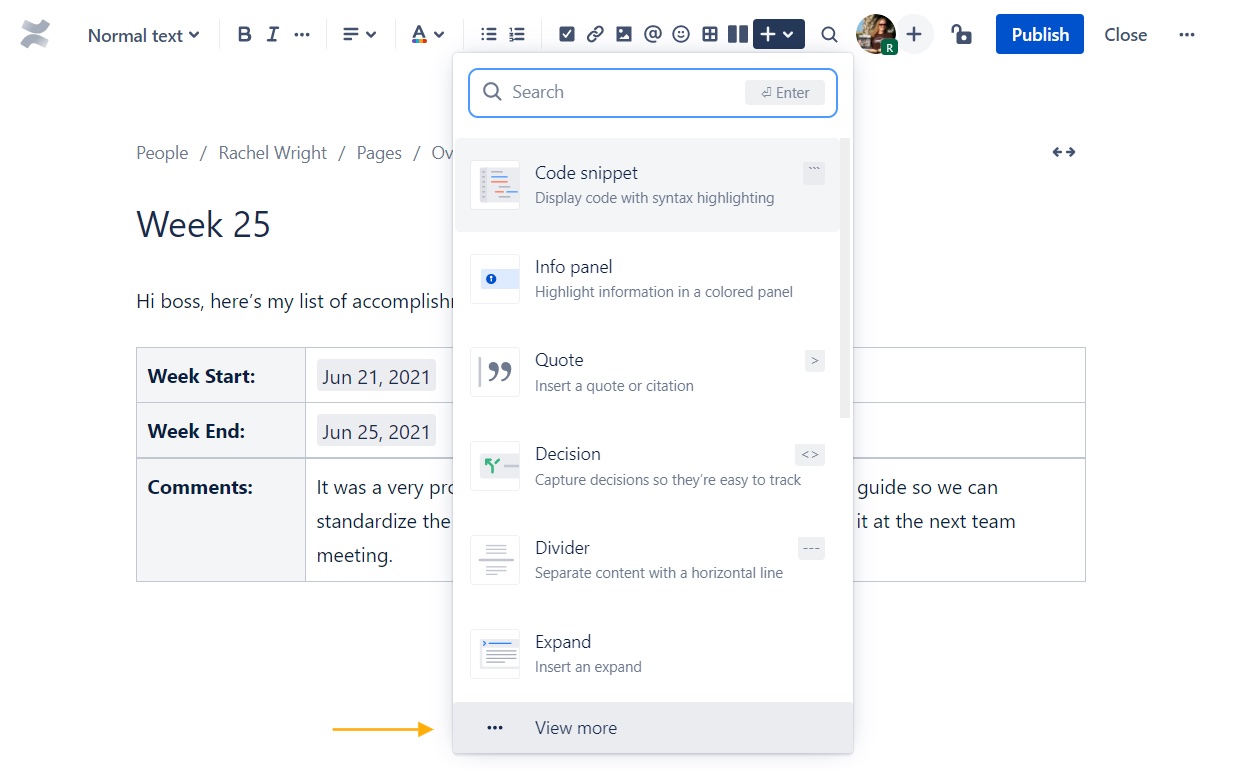
In the top editor toolbar, click the “+” icon and select “View more” at the bottom of the menu.
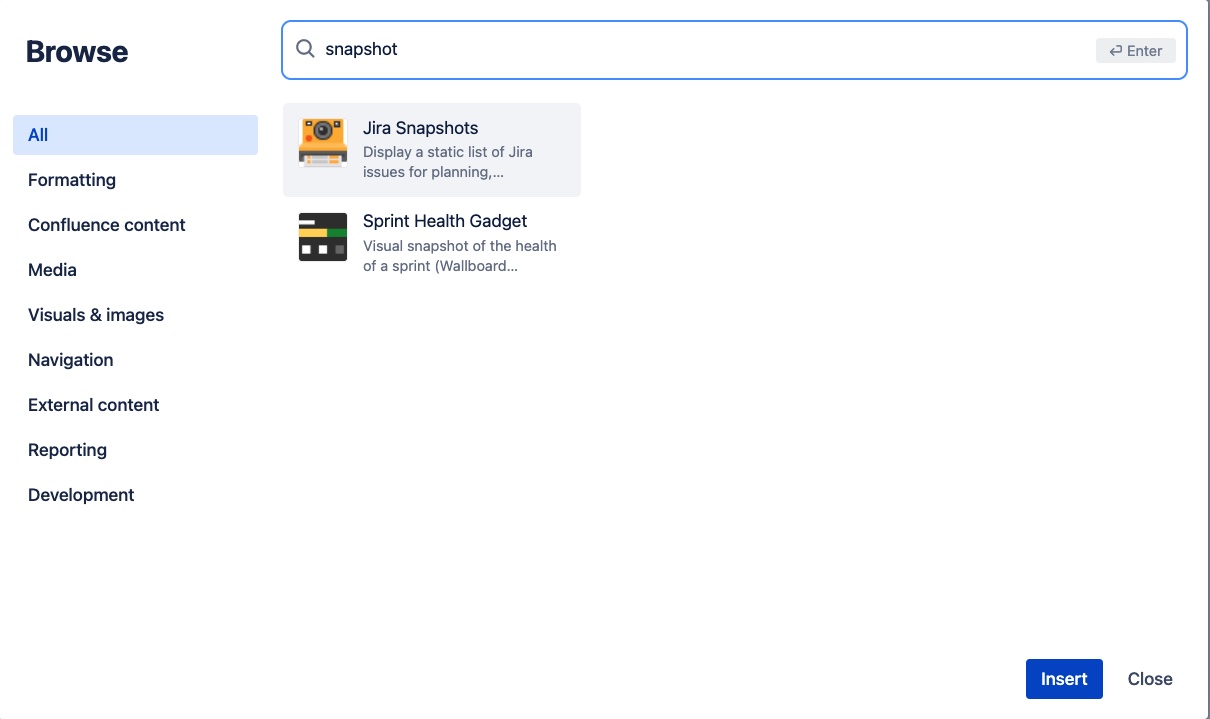
In the overlay, select the “Jira Snapshots” macro. You can find this macro via the search box at the top right.
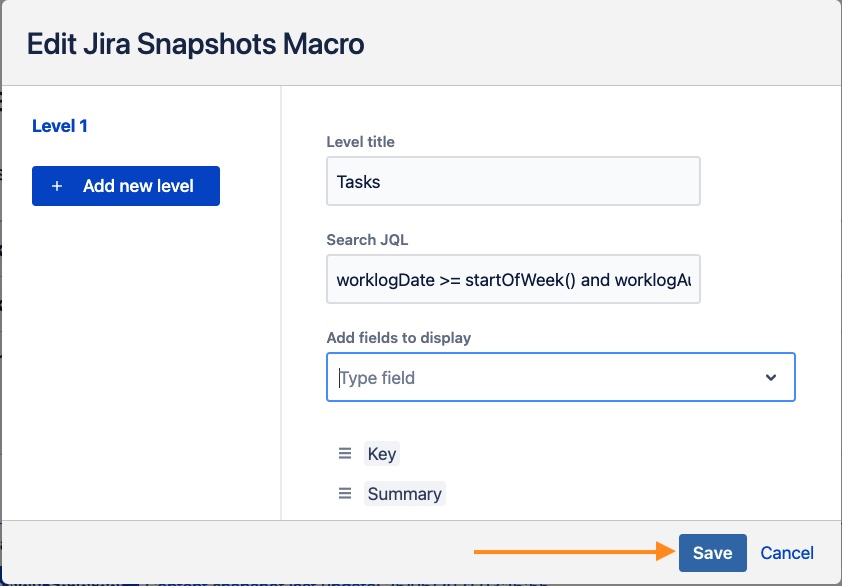
In the “Edit Jira Snapshots Macro” overlay:
Enter a title in the “Level title” field to represent the first level or “list” of Jira issues.
Enter a query in the “Search JQL” field to limit the scope of issues. For example, select only issues for which you have a logged time during the last week
Code Block worklogDate >= startOfWeek() and worklogAuthor = 557057:c0f3ae55-……
557057:c0f3ae55-…… stands for your user unique ID in Jira. (see more here )
In the “Add fields to display” field, select the list of desired fields.
 You can display most Jira standard and custom fields.
- They are added to a list, where you can reorder the fields.
Click the “Save” button at the lower right, to complete the macro configuration.
Click the “Publish” button at the top right of the page.
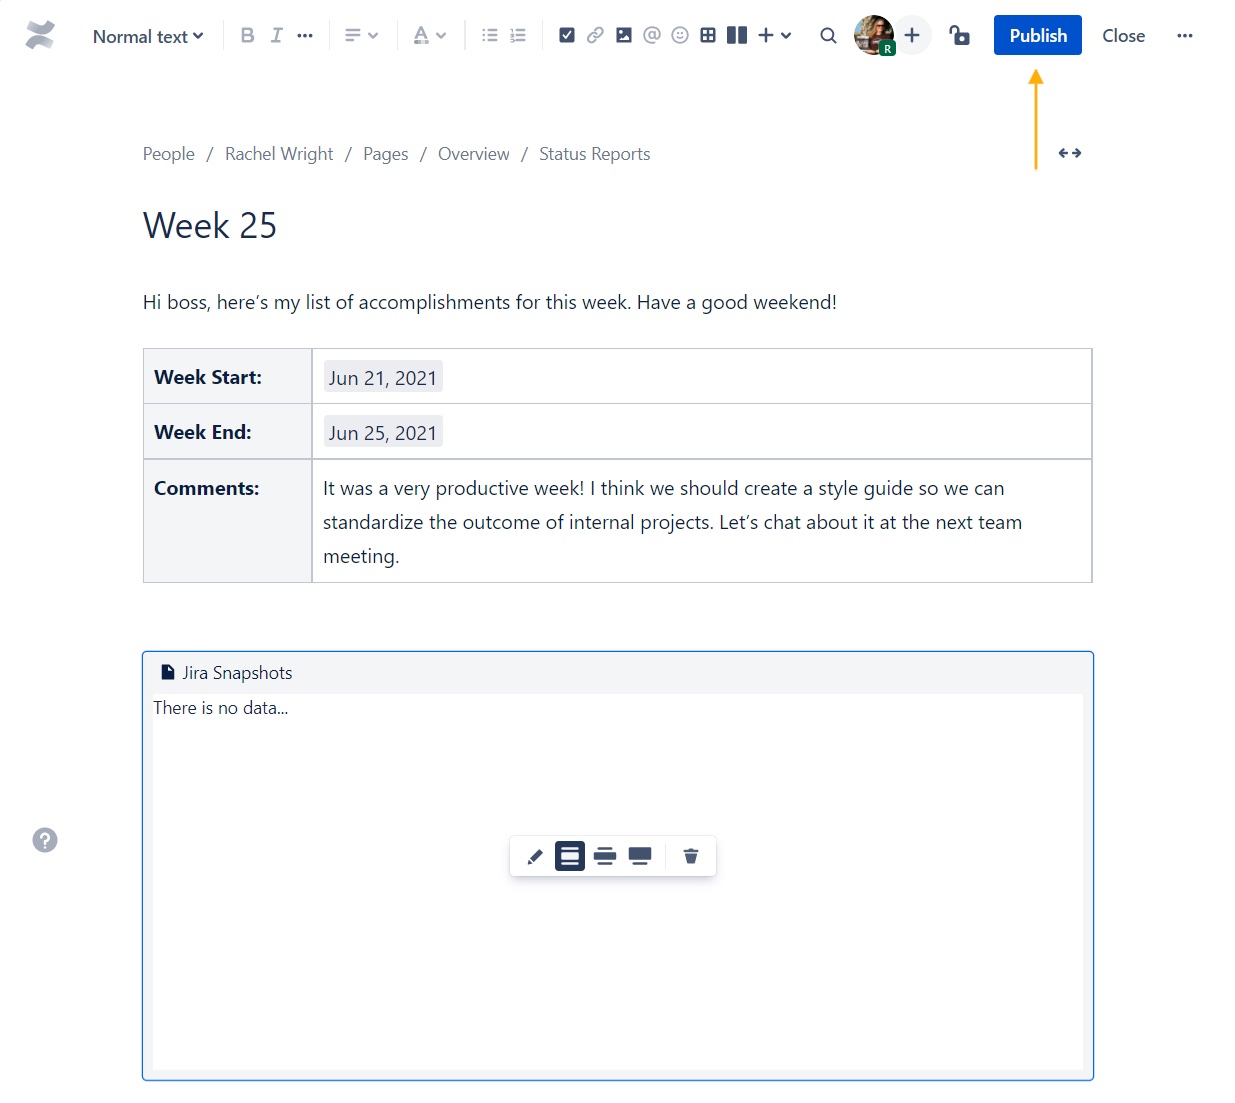
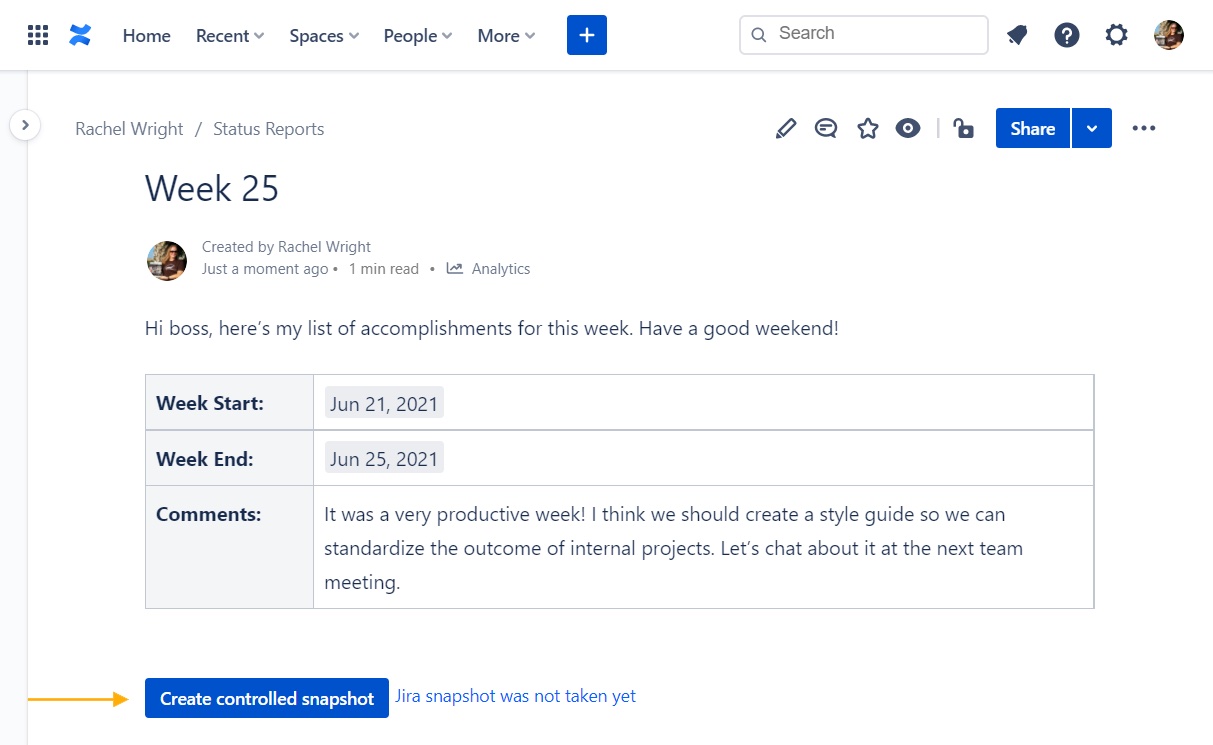
Finally, click the “Create controlled snapshot” button, to generate a static list of issues.
The Finished Result:
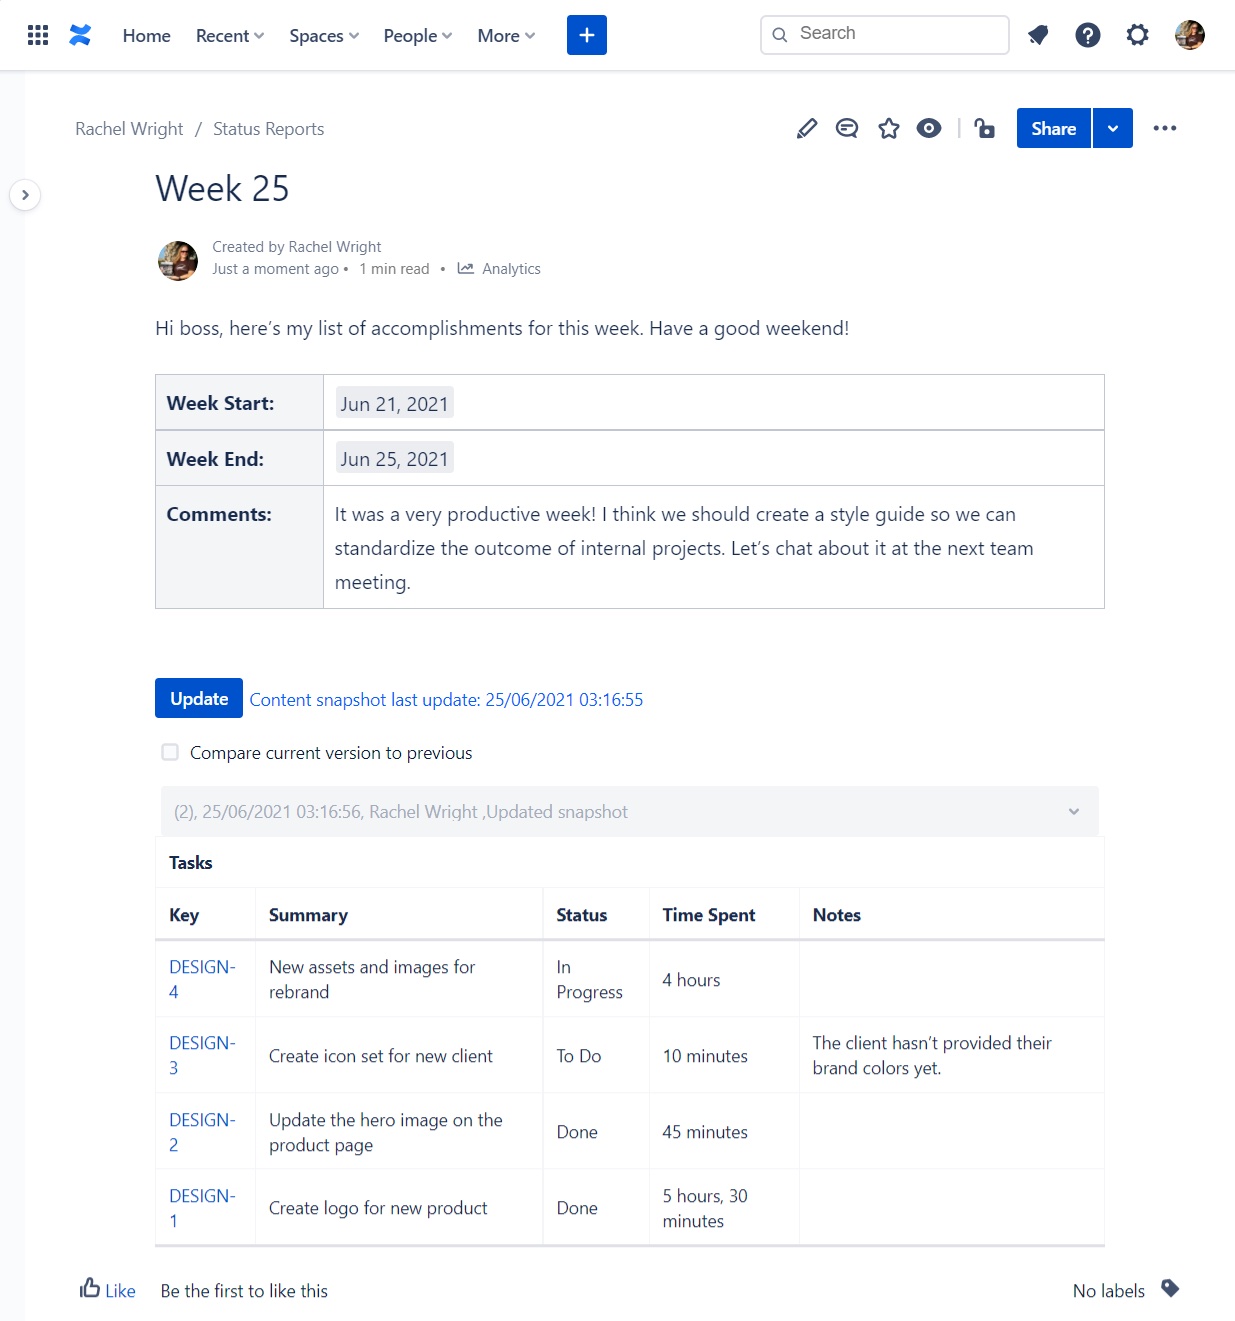
Need to change the issue list or display different information? Simply edit the macro details, and click the “Update” button on the Confluence page to take a new snapshot.
Now that there’s a trackable history of actions over time, your boss can see exactly what was done, and you can get an early start to your weekend!
| Tip | ||
|---|---|---|
Tips
|