| Info |
|---|
See this use-case live on our sandbox environment here: https://radbee-sandbox.atlassian.net/wiki/spaces/GALACTIKA/pages/73466235/Customer+Facing+Report-+Development+Weekly+Status💡 Our sandbox is on Cloud, but as Jira Snapshots functionality is the same as in Data-Center, the sandbox is useful also for Data-Center users. |
I am a project manager, working on one of our largest accounts. We hold weekly followups with the customer.
Each Wednesday morning I need to send them an up to date report, in preparation toward our Wednesday afternoon meeting. In the past I used to export Jira data to Excel, review it an ensure that it provides the correct picture without disclosing any internal noise (like the internal discussion about weather this specific customer request is justified, or some reference- so awkward- to another customer). Once properly cleaned, the excel would have been attached to a Confluence page, for sharing.
Finally, with Jira Snapshots for Confluence, I can now not only save precious time each week, but also look more professional.
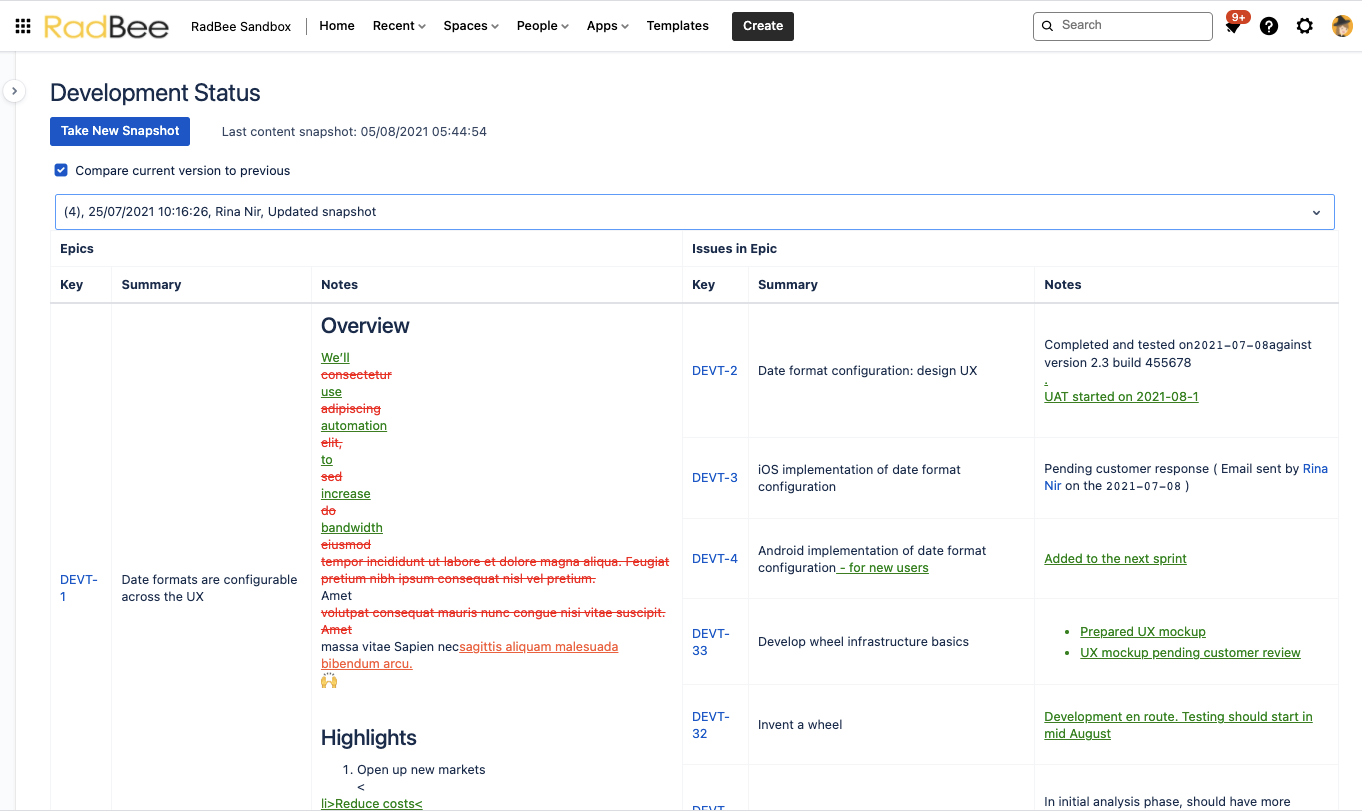
My customer especially loves how its easy for them to compare the status report of this week to the previous one- in one view they see what changed.
.jpg?version=1&modificationDate=1628250557996&cacheVersion=1&api=v2&width=544)
| Info |
|---|
Use case by Rina Nir _RadBee . RadBee’s CEO “We cannot remove the burden of regulatory compliance, but we surely can rid teams from the waste of time” |
| Tip | ||||
|---|---|---|---|---|
Tips
|
Confluence setup for Customer collaboration
In Confluence, I have created a customer facing project space. All our customer collaboration and shared documentation is concentrated there.
One page is dedicated to the “Development Weekly Status”. Once this page is setup, then each Wednesday morning I just need to update the high level information manually and take a new Snapshot. It’s always the same page, which is updated weekly, so the customer already knows where to find it and there is no need to send a new email to them- they are free to go on the page and get a preview before the meeting.
💡 The customer does not have edit access to this page, so I have full control on the scope and content of Jira data that they see. In this way, the customer gets consistent and useful information, without actually being let into “our kitchen”.
Here is how to do it
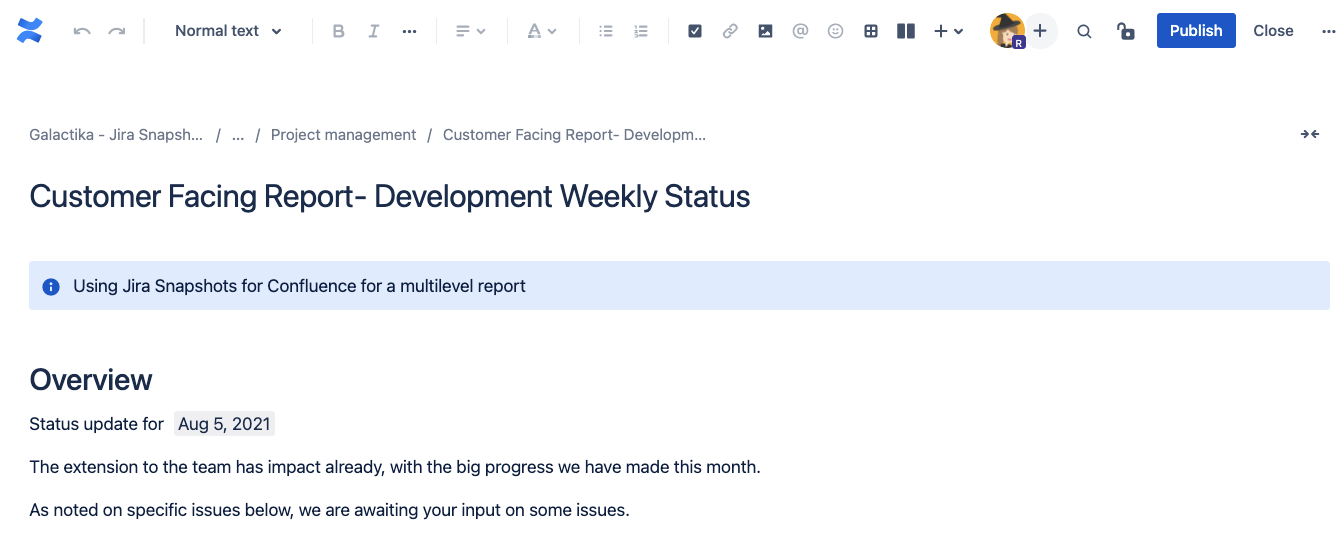
Login to Confluence and create a new page. Add to it all the free text sections, like ‘Overview’:
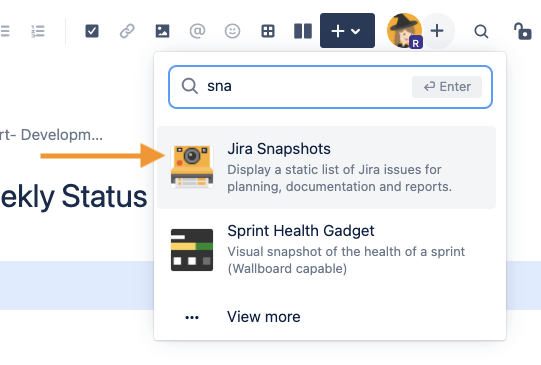
In the top editor toolbar, click the “+” icon and type “sna” in the search bar. Then, select the “Jira snapshots” macro.
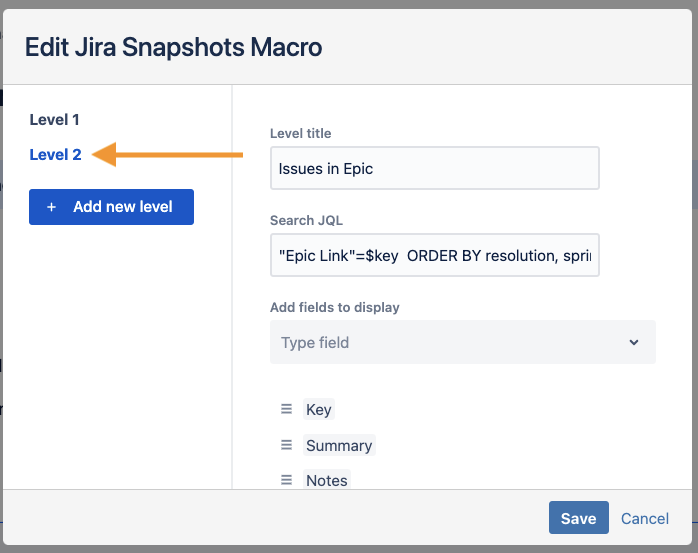
In the “Edit Jira Snapshots Macro” overlay:
Enter a title in the “Level title” field to represent the first level or “list” of Jira issues.
Enter a query in the “Search JQL” field to limit the scope of issues, like:
Code Block "Epic Link"=$key ORDER BY resolution, sprint, rank ASC
In the “Add fields to display” field, select the desired columns.
💡 We are adding the field “Notes” which in our team, is always kept clean and is only used for customer communication.
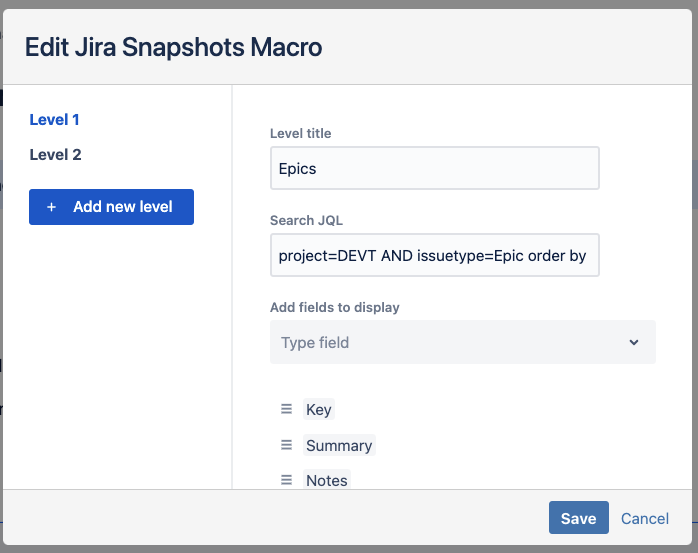
Our report includes also the issues within the Epic, so we’ll press the button “+ Add new level”
Enter a title for the 2nd level
Enter a query in the “Search JQL” field. This time it needs to link with Level 1, like:
Code Block issue in linkedIssues($key,"is tested by") AND fixVersion = V1.0 order by key ASC
In the “Add fields to display” field, select the desired columns.
Click the “Insert” button at the bottom right to complete the macro’s configuration.
Click the “Publish” button.
Finally, click the “Take New Snapshot” button to generate a static list of issues.
Here’s the finished result- for the first week
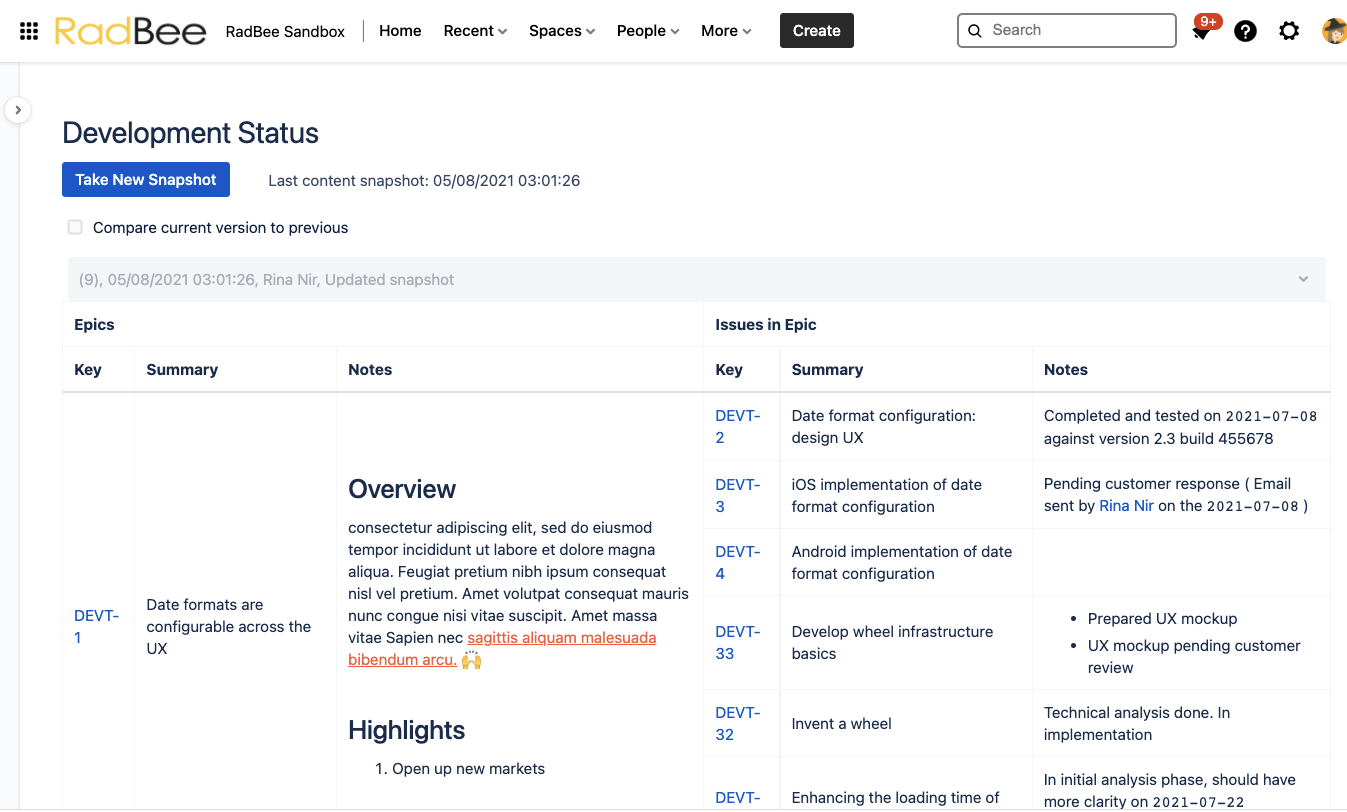
The following week: Just take a new Snapshot on the same page. Your customers will be able o compare the status of the current week with the status in the previous week- by clicking the “Compare current version to previous”